On the Statistics tab, you can view various statistics
The "What if...?" mode is also available, in which you can test trade filtering hypotheses.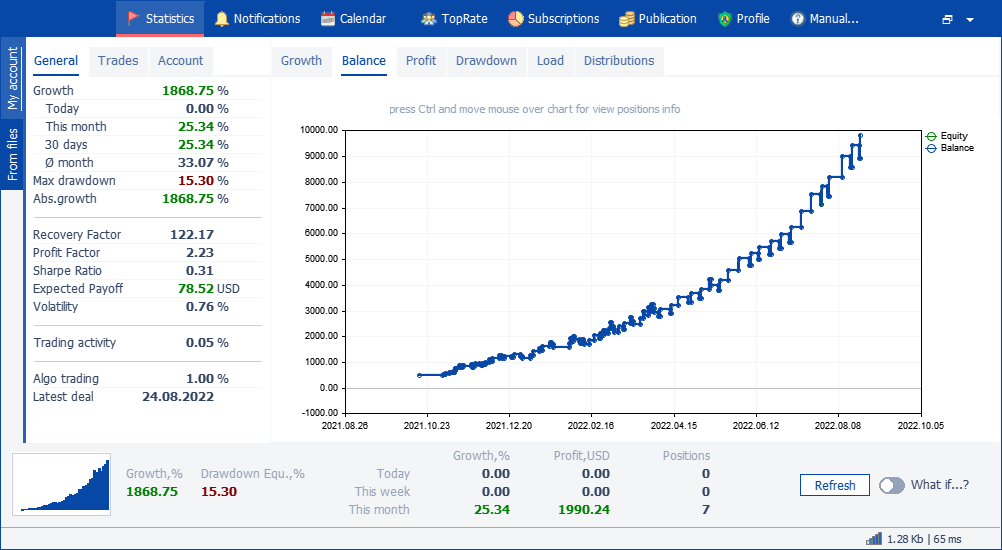
View of the Statistics tab
Parametric statistics are displayed in three tabs on the left side of the application:
Graphic statistics are displayed in the central part and are presented in the form of 11 graphs and charts:
- Growth
- Balance
- Profit
- Drawdown
- Load
- by day of the week
- by hour
- by hold time
- by potential profit/loss
- by symbols
- by magics
Trade distribution
Parametric statistics
General
- Growth – TWR for all time by balance (otherwise by equity, if available)
- Growth for today – TWR for the current day
- Growth for this month – TWR for the first of the current month
- 30 Day Growth - TWR over last 30 days
- Average monthly growth is the arithmetic mean of all monthly TWRs
- Max. drawdown – maximum account drawdown by balance (otherwise by equity, if available)
- Absolute growth - the ratio of the amount of profit to the amount of balance operations
- Recovery factor – the ratio of the current TWR to the maximum TWR drawdown (according to the balance)
- Profit factor – ratio of profit to loss
- Sharpe Ratio – Calculated Sharpe Ratio
- Mat. expectation – the ratio of the amount of profit to the number of trades
- Volatility - calculated volatility ratio
- Trading activity – the ratio of the time of having open positions to the entire lifetime of the account
- Algo trading – the ratio of the number of positions opened by Expert Advisors to the total number of positions
- Last trade – the time of the most recent trade on the account
Trades
- Positions profitable – number of positions closed with profit
- Unprofitable positions – the number of positions closed with a loss
- Long positions – number of BUY positions
- Short positions – number of SELL positions
- Average holding time is the arithmetic mean of the time from opening to closing positions
- Series of profitable positions - the largest number of consecutive profitable positions
- Series of unprofitable positions – the largest number of consecutive unprofitable positions
- Trading days – the number of days in which trading operations were performed. And also the ratio of this amount to the entire lifetime of the account.
- Trading days profitable – the number of days that closed with a profit
- Unprofitable trading days – the number of days that closed with a loss
- Series of profitable days – the largest number of consecutive days that closed with a profit
- Series of unprofitable days – the largest number of consecutive days that closed with a loss
- Trading weeks – the number of weeks in which trading operations were performed.
- Positions per week – the ratio of the total number of positions to the number of trading weeks.
Account
- Broker name – the name of the broker where this account is located
- Leverage – leverage of this account
- Type – broker account type
- Time zone – which time zone the broker operates in
- Start – the time of the first known trade on this account
- Age – time since Start
- Deposits – amount and number of deposits
- Withdrawals – amount and number of withdrawals from the account
- Total result - the sum of profit and loss for all positions in the money
- Total profit – the sum of only profits for all positions in money and points
- Total loss – the sum of only the loss on all positions in money and points
- Balance – current account balance
- Maximum balance – time and value of the account balance when it was at its maximum
Graphic statistics
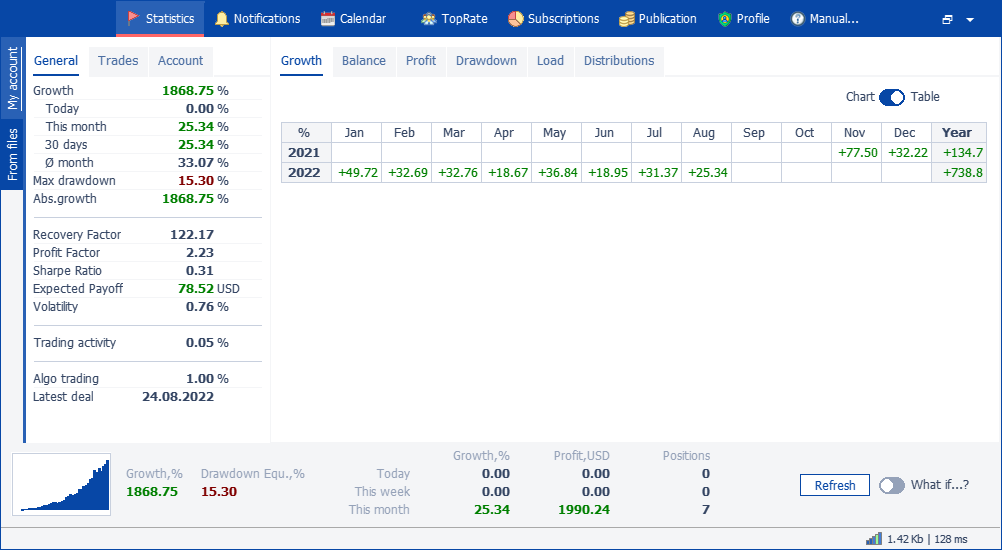
Growth
Displays how the TWR value has changed. An option to view TWR values for each month is also available.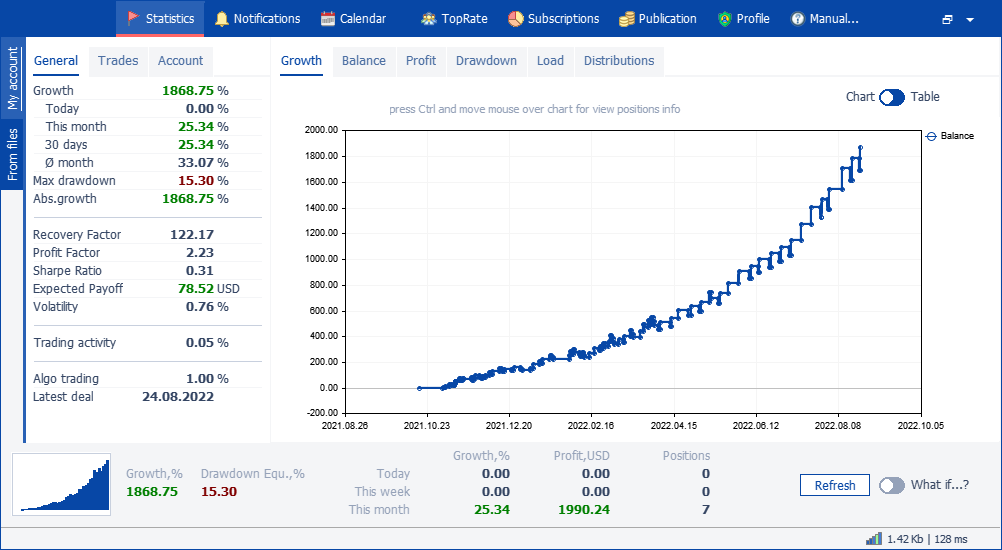
Balance
Displays how the balance has changed, as well as equity, if available
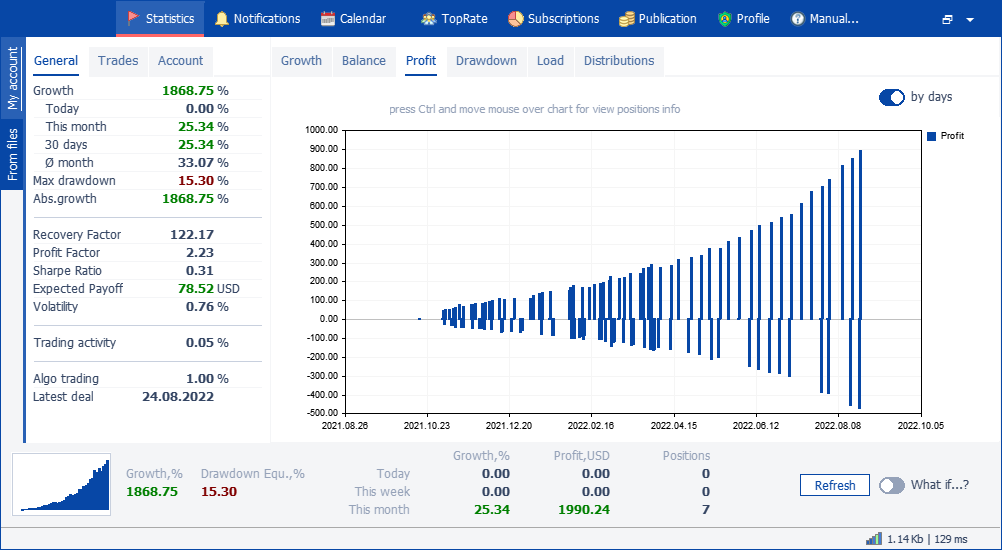
Profit
Displays how the value of the total amount of profit and loss has changed. Also available is the option to view profit values for each month.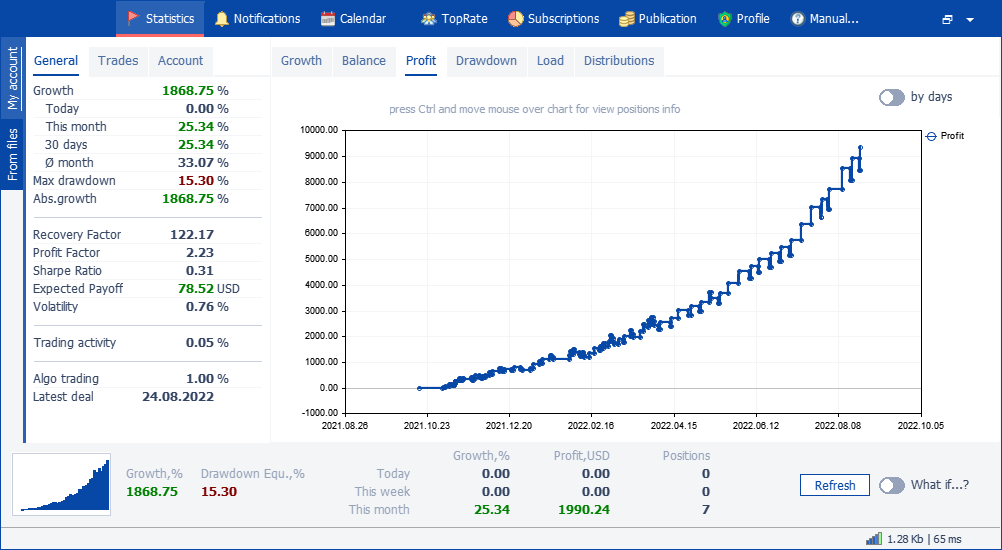
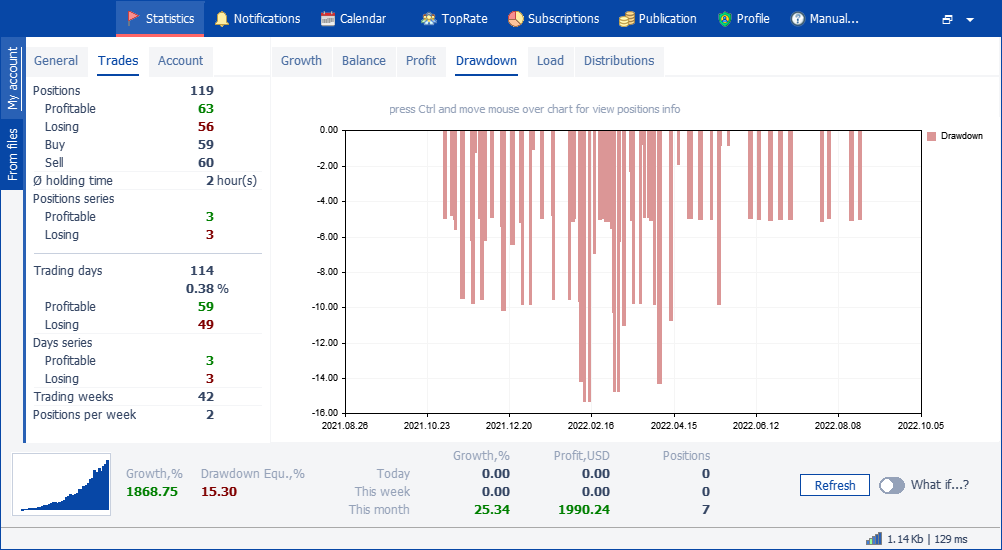
Drawdown
Displays how the drawdown on the account has changed
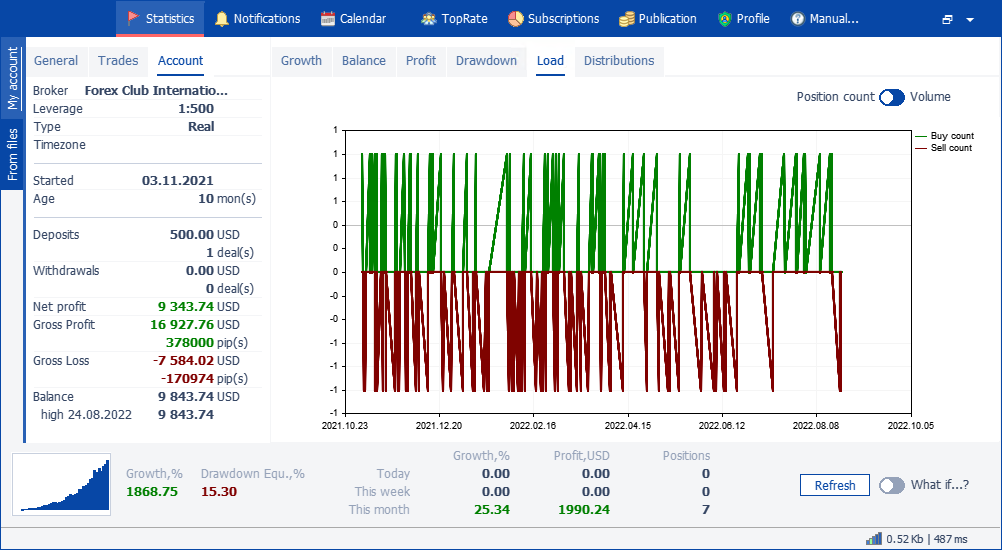
Load
Displays the size of open positions
Distribution by days of the week
Displays the total number and profit of positions opened on one of the days of the week.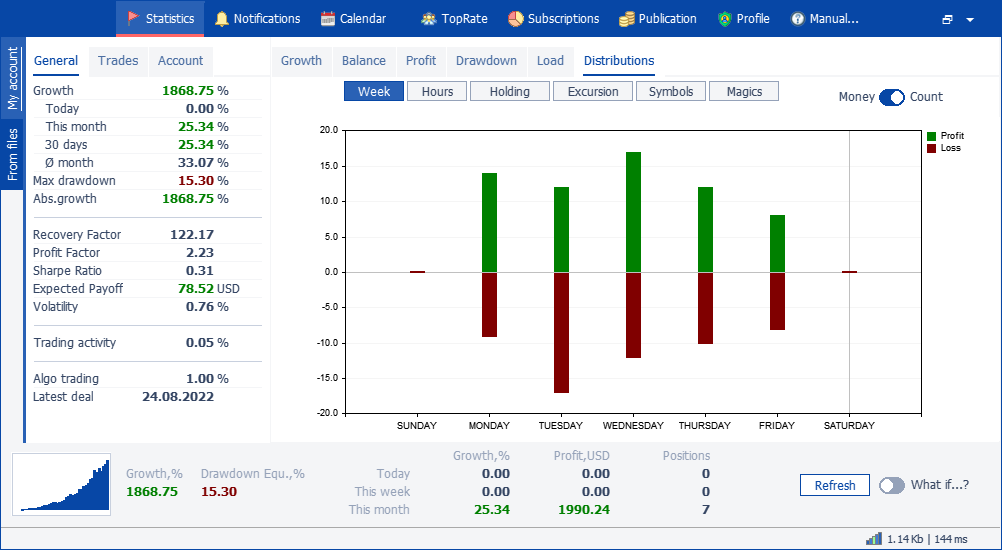
Distribution by hour
Displays the total number and profit of positions opened at one of the hours of the day.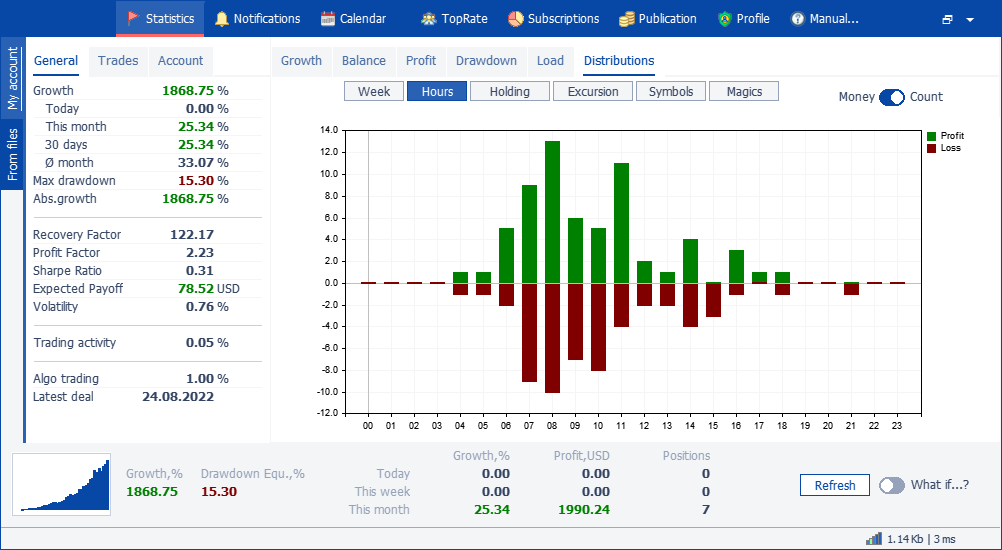
Distribution by hold time
Displays the number and profit of positions depending on the duration of their life.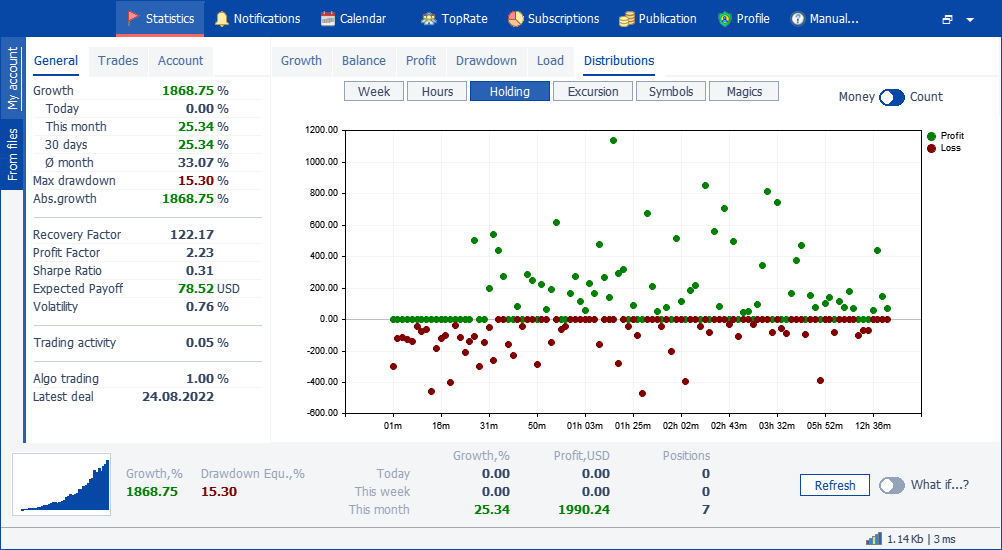
Distribution by potential profit/loss
Displays the position of each position on the MFE charts - the maximum profit value that the position has achieved during its life. In other words, an estimate of lost profits. And MAE - the maximum value of the loss, which was achieved by the position during its life. In other words, the estimate of oversitting the loss.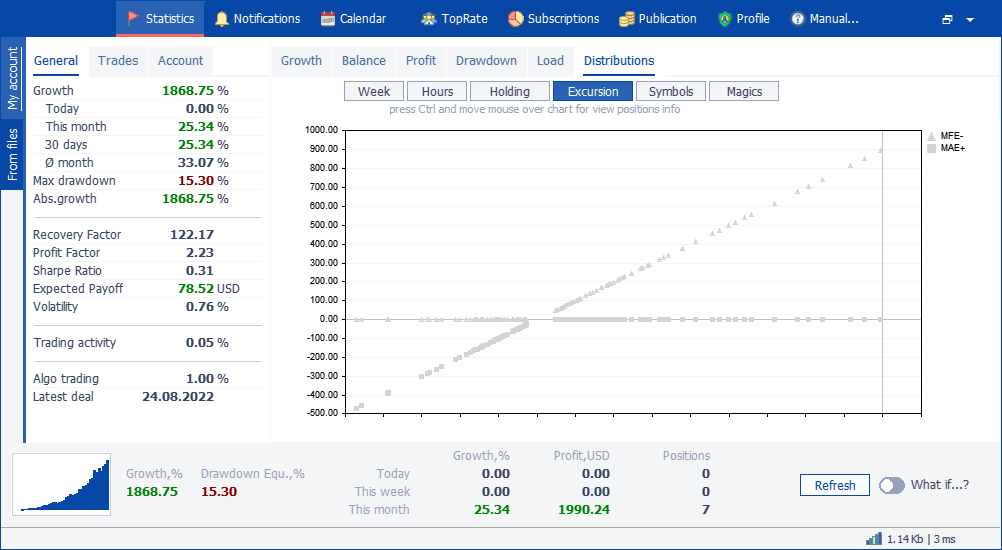
Character distribution
Displays the total number and profit of positions for each symbol.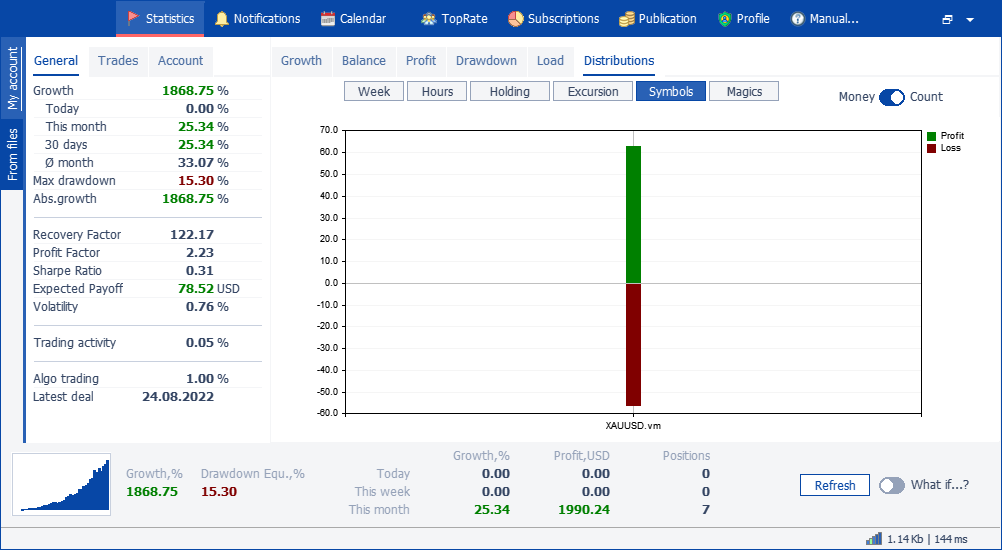
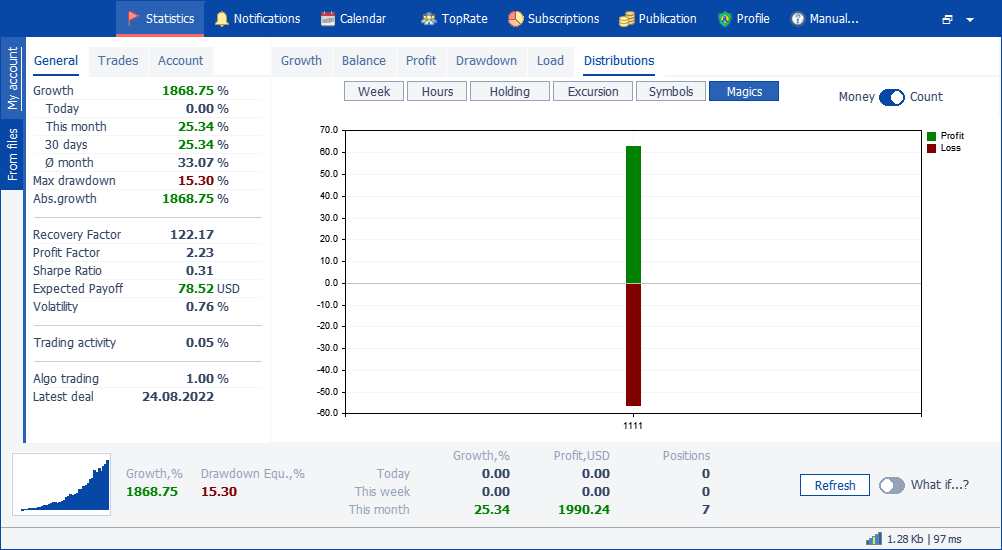
Distribution by magics
Displays the total number and profit of positions for each magic