


The application allows you to work with trading report files created according to the MQL signal service format.
You can create your own files, share them with others.
You can also download them from the MQL service itself.
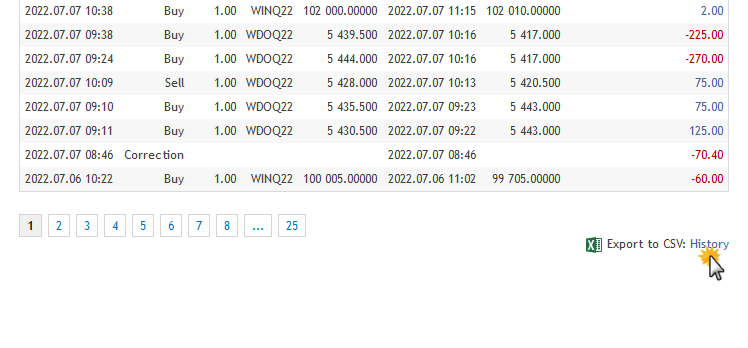
To get the history of an MQL signal, download the CSV file from its page under the trading table.
Creating and viewing a portfolio
1. Go to the "Statistics" tab in the "From files" section.
You will have an additional tab "Files"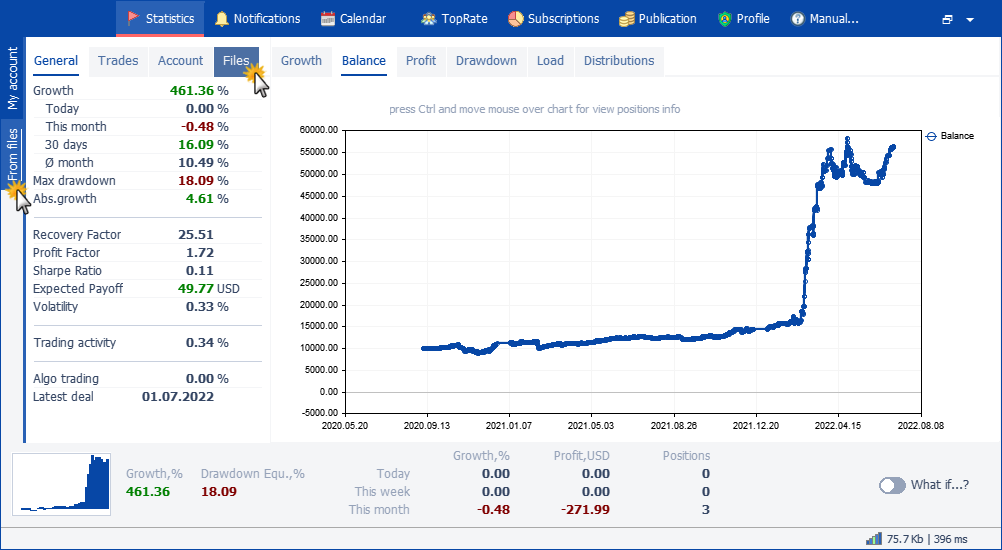
2. On the "Files" tab, click the "Create" button
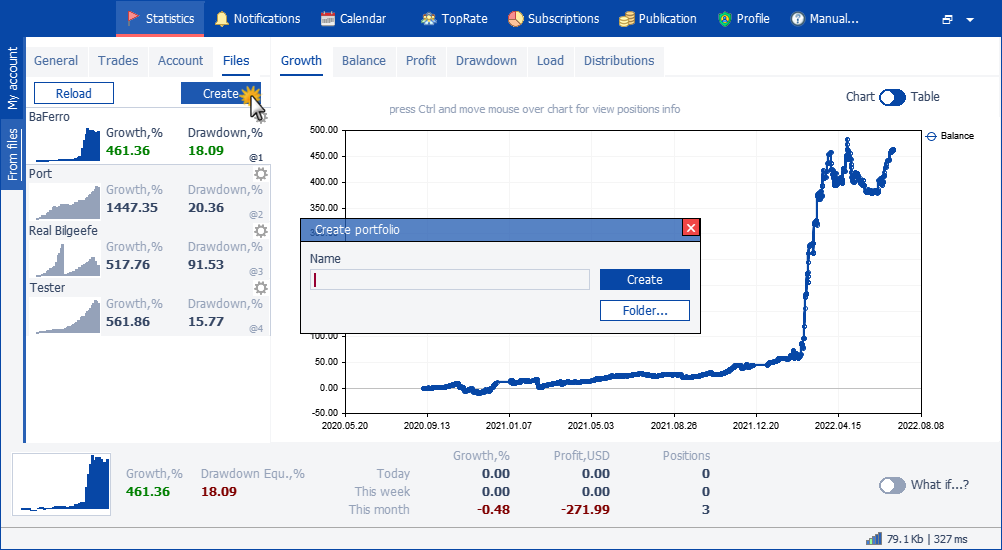
In the window that appears, enter a name for the portfolio you are creating.
Click the "Folder..." button. You will see a public folder where all portfolios are stored.
Click the "Create" button. The newly created portfolio folder will appear in the shared folder. Place CSV files (downloaded from MQL signals or created by yourself) into this folder.
3. In the created portfolio, click on the "Customize" button (looks like a gear in the upper right corner)
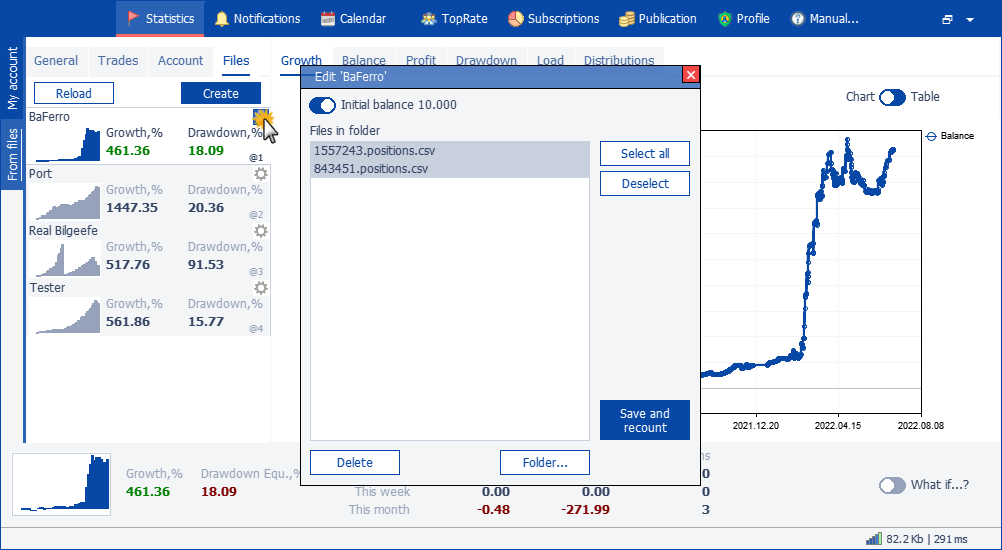
If there were correctly formatted CSV files in the folder, they will be displayed in the "Files in folder" list.
Select the required files by clicking on them, or you can select all at once by clicking the appropriate button to the right of the "Select All" list.
If you want to make a portfolio calculation from several CSV files, it is recommended to use the same initial balance. This is necessary so that none of the CSV files dominate the graphs and statistics.
You can do it yourself by editing each CSV file. But you can also enable the top option "Initial balance 10000". The application proportionally normalizes all values of the received profit by 10000.
To complete the setup and see the final statistics, click the "Save and Recalculate" button.
To delete the portfolio folder completely along with files and calculated statistics - click the "Delete" button.